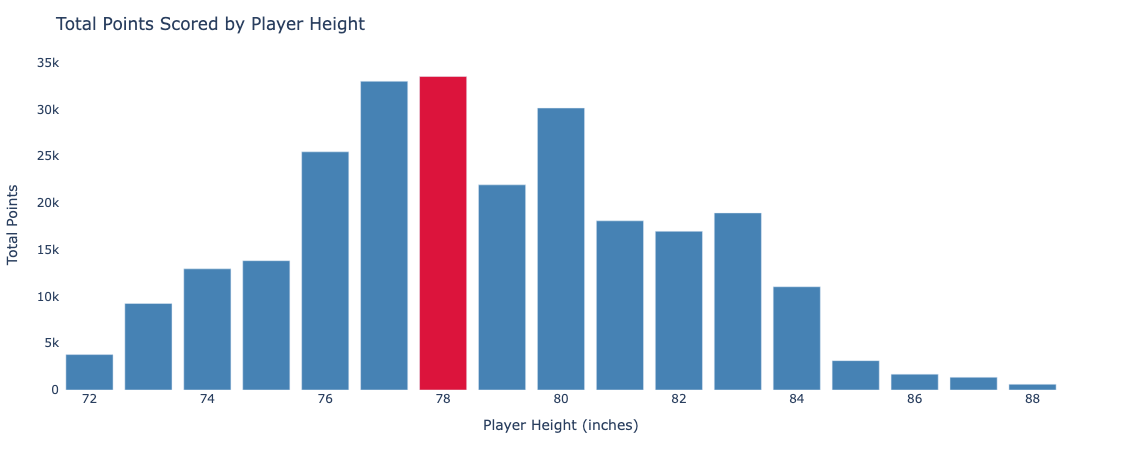
I must start this article with an admission. There exists within this world a subset of people who believe that height directly correlates to success when it comes to the beautiful sport of basketball. In a brief moment of outrage, I was blinded and made the now regrettable claim that shorter players score more points in the NBA than taller players. After taking the time to crunch the numbers, it appears I must put aside my pride and admit that I was wrong. The chart to the left of this text consists of points scored in the 2024-2025 NBA Regular Season broken down by height. The column highlighted in red - 78 inches - represents the players listed 6' 6", and was used as the differentiator between a "short" and "tall" player. While it may appear close in this graph, it was anything but. Players listed shorter than 6' 6" scored a total of 98,251 points this season, while players listed taller than 6' 6" scored 123,868 points - a whopping 25,617 point difference! The casual analyst may have given up at this point, content with admitting defeat and willing to live the rest of their life in shame. Fortunately, I am no casual analyst.
Determined to gain back at least some pride of basketball knowledge, I pivoted. While taller basketball players may score more points, that doesn't necessarily mean they're better or more successful. To test this theory, I turned to the overall winning percentages of teams across the league. Specifically, I sought to compare the winning percentages of teams based on where the majority of their scoring came from. Using the same dataset that was used to generate the above graph, I found that 10 teams in the league had more points come from players shorter than 6' 6" than above. Across those 10 teams, the average winning percentage was a respectable 54%, translating to a record of roughly 44-38. This leaves us with 20 teams that had more points scored by players over 6' 6", and interestingly enough those teams averaged a winning percentage of only 48%, which would translate to a record of about 39-43. Below you will find the full breakdown of point origin and winning percentages across the league: